Errata
Please, report any mistakes that you may find in the book to christian [dot] tominski [ät] uni-rostock [dot] de.
🤦🏻♂️ Known mistakes
- p. 19, Table 2.2: The dots in the table are incorrect. They need to be mirrored along the diagonal. Here is the corrected Table 2.2.
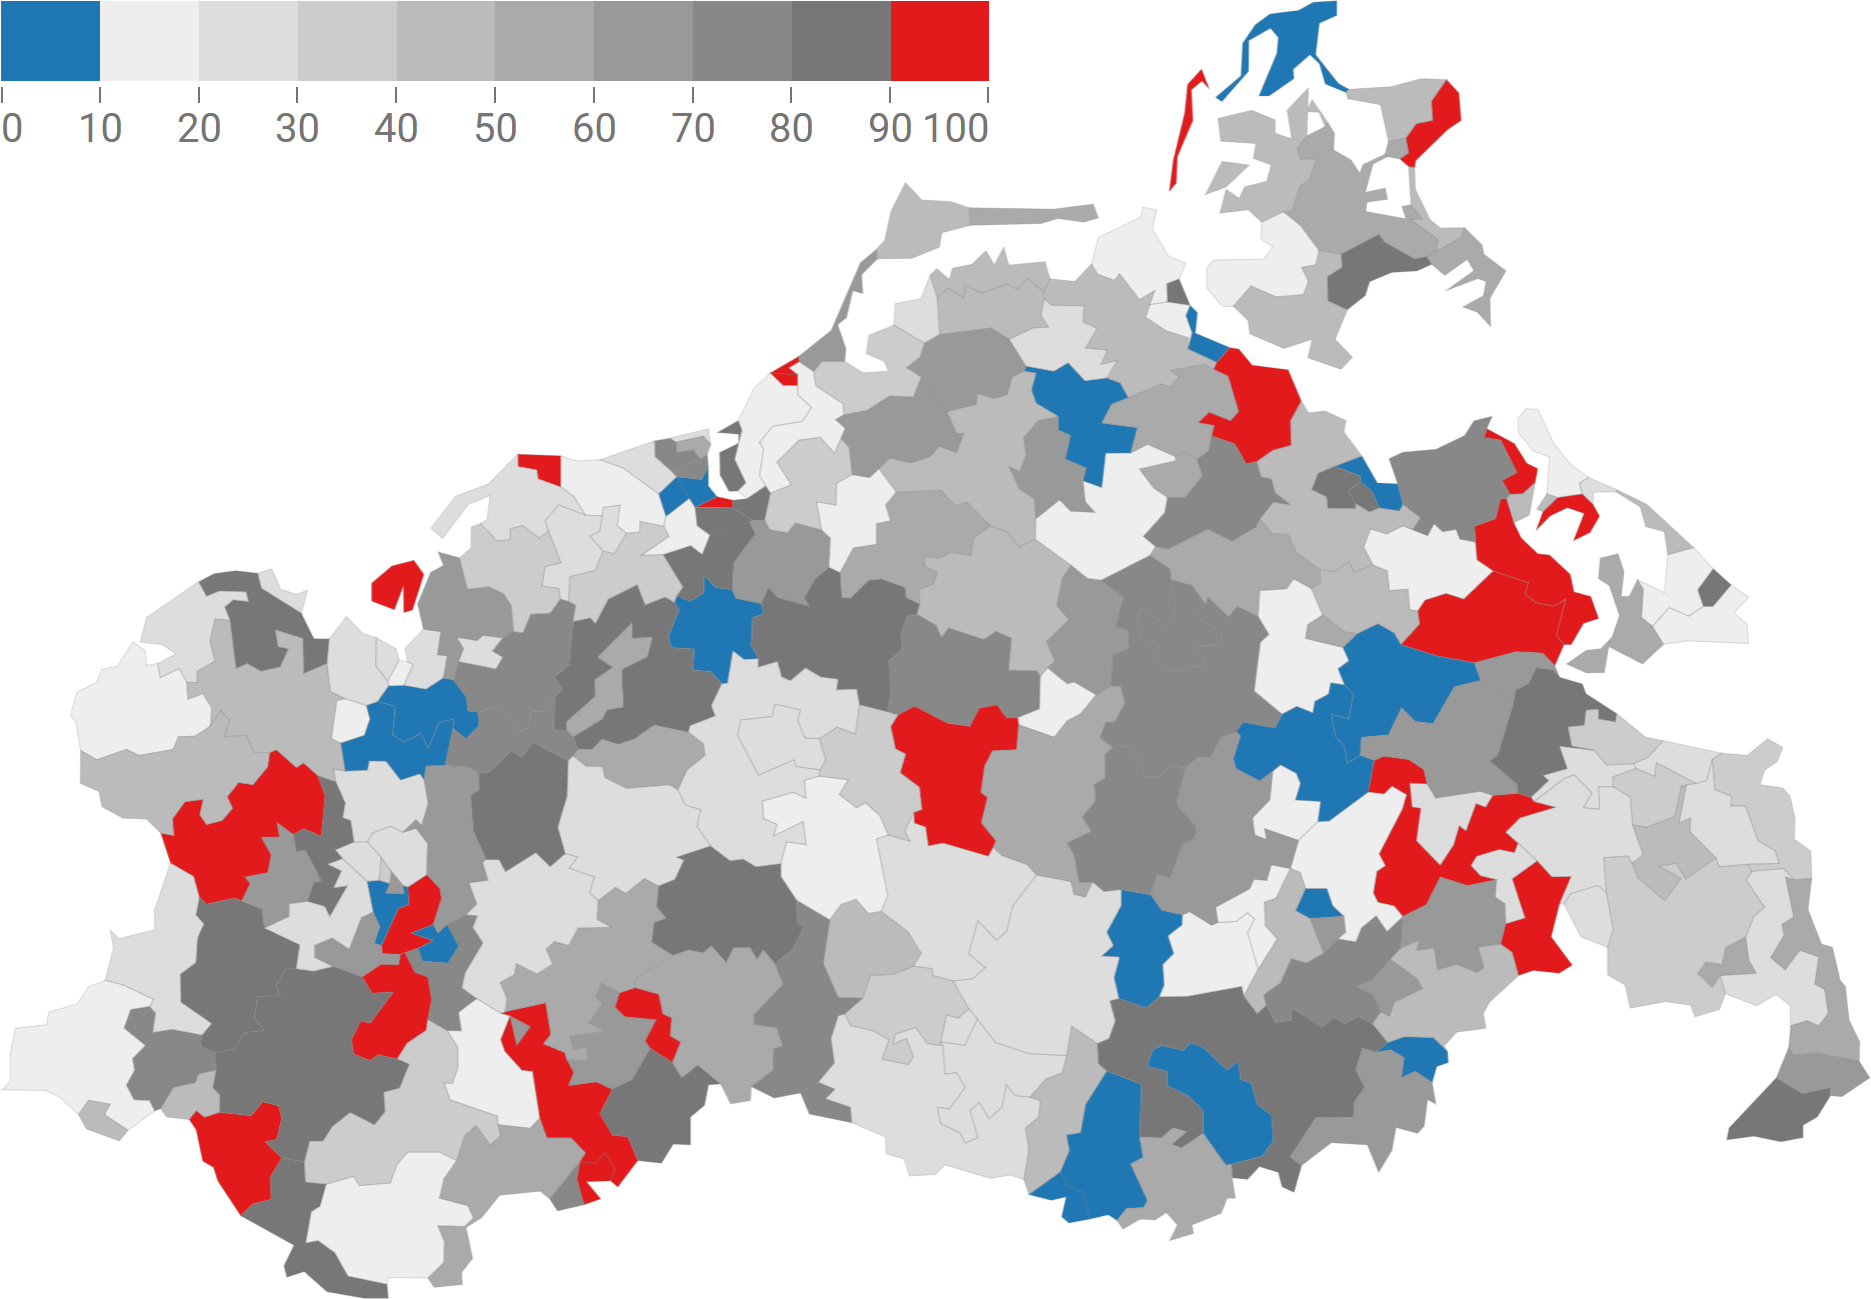
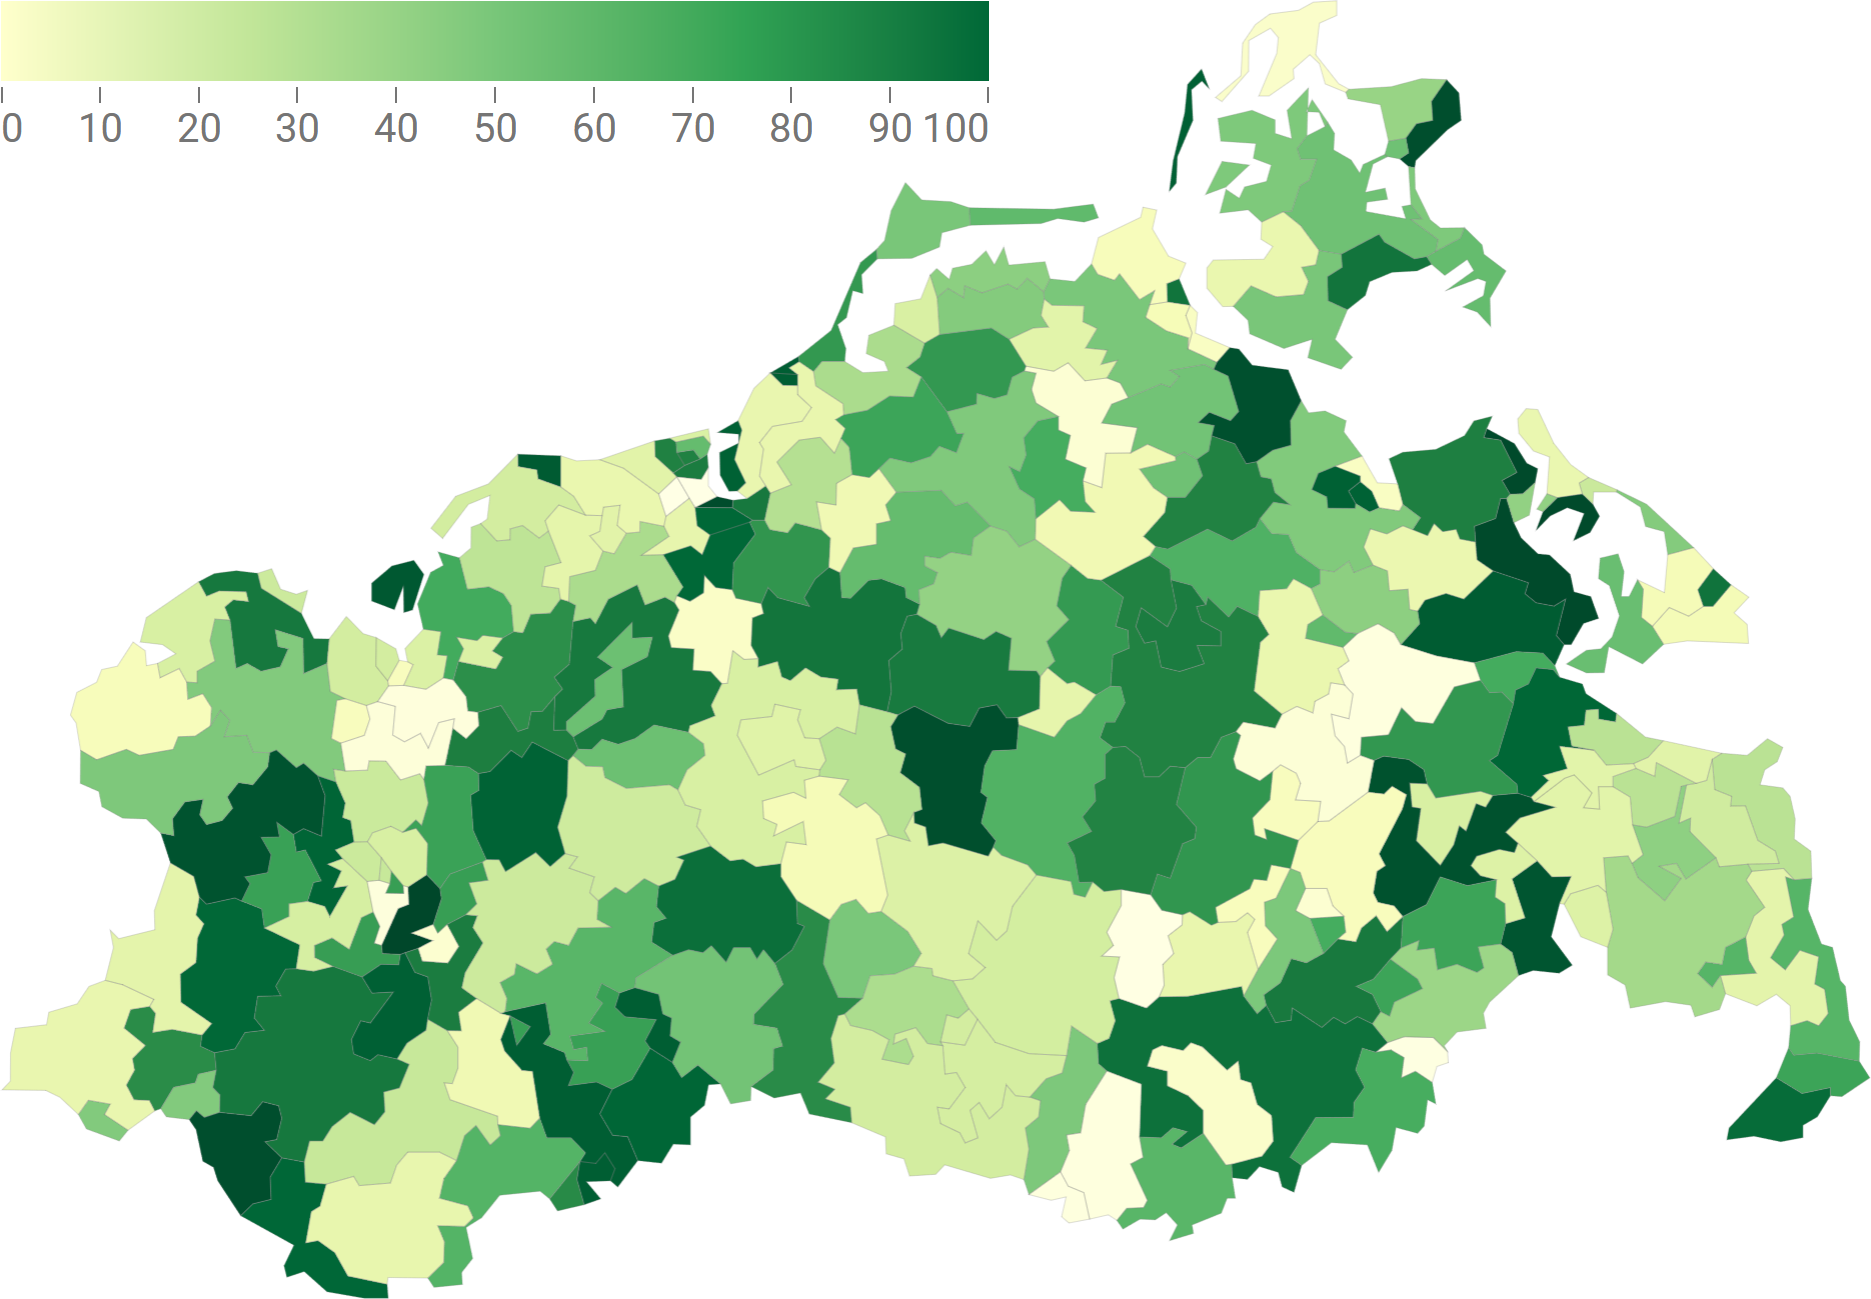
- p. 29, Figure 2.8b: The order of the gray-tone colors in the map visualization is flipped and the grays are not evenly distributed. You can download a corrected version of Figure 2.8b and also a correspondingly adapted version of Figure 2.8a.
- p. 78, Mosaic plots: The explanation is not consistent with the example in Figure 3.27. The text suggests that the display space is first split along the horizontal axis, then along the vertical axis, and again along the horizontal axis. In Figure 3.27, however, the first split is along the vertical axis, then along the horizontal axis, and finally again along the vertical axis. Actually, one can start with either axis. The key point is to alternate between axes when splitting the display area.
- p. 80, Typo: "[...] linking & brushing." should of course be "brushing & linking.".
- p. 142, Typo: "[...] represent the view [...]" should be "[...] represents the view [...]".
- p. 230, Typo: Subheading "Movment" should be "Movement".
- p. 313, 316, 333, References [BHvW00], [DGH03], [SM07]: The Visualization & Graphics Technical Committee is wrongly abbreviated as TCVG. Correct is VGTC.
- p. 319, Reference [FS04]: The URL is invalid. The following URL can be used instead: https://www.irma-international.org/proceeding-paper/intelligent-icon-positioning-interactive-map/32349/.
- p. 343, Figure 3.24b: The attribution given for this figure is incorrect. The correct full attribution is: © 2005 IEEE. Reprinted, with permission, from Nocke, T. et al. “Icon-Based Visualization Using Mosaic Metaphors”. In: Proceedings of the International Conference Information Visualisation (IV). IEEE Computer Society, 2005, pp. 103–109. doi: 10.1109/IV.2005.58.